Thursday, January 31, 2008

VAR


VAR is struggling to stay above its 50 sma. I'd look to short up at near 54 to at around the 50 sma for a range trade. However, after the trade, I'd continue to watch this one as a break and close below the 50 sma could mean some downside is on the way. Stop out above 54.50.

Friday, January 25, 2008

Looking for a Top/Range in USO


USO might be forming a top here. Look at the chart. A divergence in RSI and price action shows that USO's uptrend is weakening and could be falling apart. A higher high in price, a lower high in RSI. Support holds, but RSI shows a lower low.

In addition to this pattern, USO's price action hints that this may be a top. Currently, the etf looks to be heading back up to 77ish (resistance). If that rally fails at that level or before, you'll have a nice topping pattern. Price will then likely fall back down to support at 68.25ish. At that point, look for a break in that level for confirmation of a top.

An alternate scenario is that USO could simply be in a range and will continue trading back and forth from support to resistance. If this is the case, then go long at support and short at resistance with stops placed conservatively.

I'll keep watching this patterns and will update in the days/weeks ahead.

BIIB Can't Move Higher; Sell


BIIB is currently trading at 58.62. It could still move a bit higher from here but it looks like the 200 sma is keeping it from moving significantly higher. I would look to sell right around this level or 59. Be aware of a break above the 200 sma as it could lead to a rally up to the 50.

Wednesday, January 23, 2008

Take Another Quarter Off

I'd take another quarter off here right around 59ish. It's a volatile market and you don't want to give away any of these gains.

Support Holds on BIIB


Support held and we're rolling higher (currently 57.94). I'd take off a fourth of a position here but still hold the rest until further notice. 3 bucks in a day is nothing to complain about!

Tuesday, January 22, 2008

Looking at BIIB


BIIB has held up pretty well throughout this mess. Look at the chart. Besides the fact that it was slaughtered when no one showed up to buy it, it looks pretty steady. There is support at 55 dollars which it is now coming down to. I think it is buyable at that level with relatively little risk. Stop out a percent or so below 55.

Monday, January 21, 2008

Broad Markets In Trouble


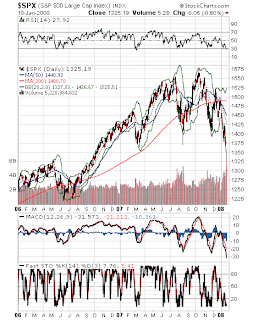
S&P Futures are pointing to a large gap to the downside in response to a vicious selloff in world equities. As I've shown in previous charts, the S&P and other broad US indices are topping out. Now that we've broken the neckline on the S&P's head and shoulders pattern, the S&P will likely trade down to 1250. How did I get that target? Take the distance from the neckline to the top of the head and reflect it downward. Once we reach that level, I might be interested in taking a look at buying. Before then, I'm highly skeptical.

You can't deny that we now have capitulation in stocks. Why? We are down 10% in one month! Also, look at almost any chart. Everything is weak, topping out or falling apart. Furthermore, there are no more safe havens. Everything, including the most defensive companies are getting sold. First money flowed to tech, then to healthcare, then to biotech. But all of those are now failing to attract "safe haven" money.

This pace of selling is not sustainable. Soon, sellers will have overdone everything and priced in a permanent recession. This is already beginning to happen as the good is starting to go out with the bad. We'll just have to wait for a reliable technical signal to occur before looking at anything on the long side. Meanwhile, watch the Fed panic and try and salvage things; KEY WORD = TRY.